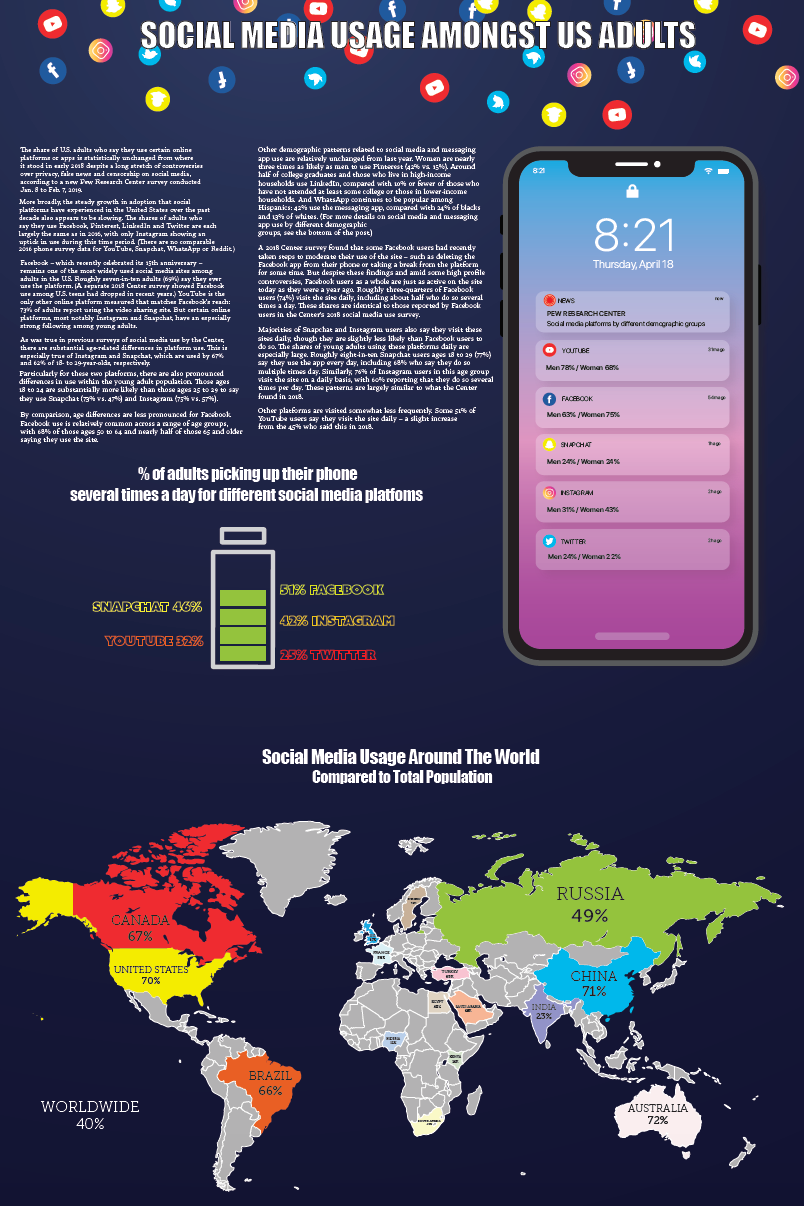
Our objective was to design a poster that utilizes data visualization to express the content of a news article and explores various sources, ties, and relationships within the article. We had to consider how form, charts, graphs, images, illustrations, and typography can allow a viewer to comprehend the information detailed within the article.

Poster Size: 11 x 17
I chose to do a data visualization poster based off a social media article. The article highlighted, and included statistics regarding social media usage amongst adults in the US. I used different visualization methods to help the viewer comprehend the details within the article.
